
Did Port of Antwerp-Bruges Surpass Rotterdam in Q1 Container Throughput?
Port of Antwerp-Bruges did not surpass Rotterdam in Q1 container throughput. The verified TEU and tonnage figures, and what drove the quarter.
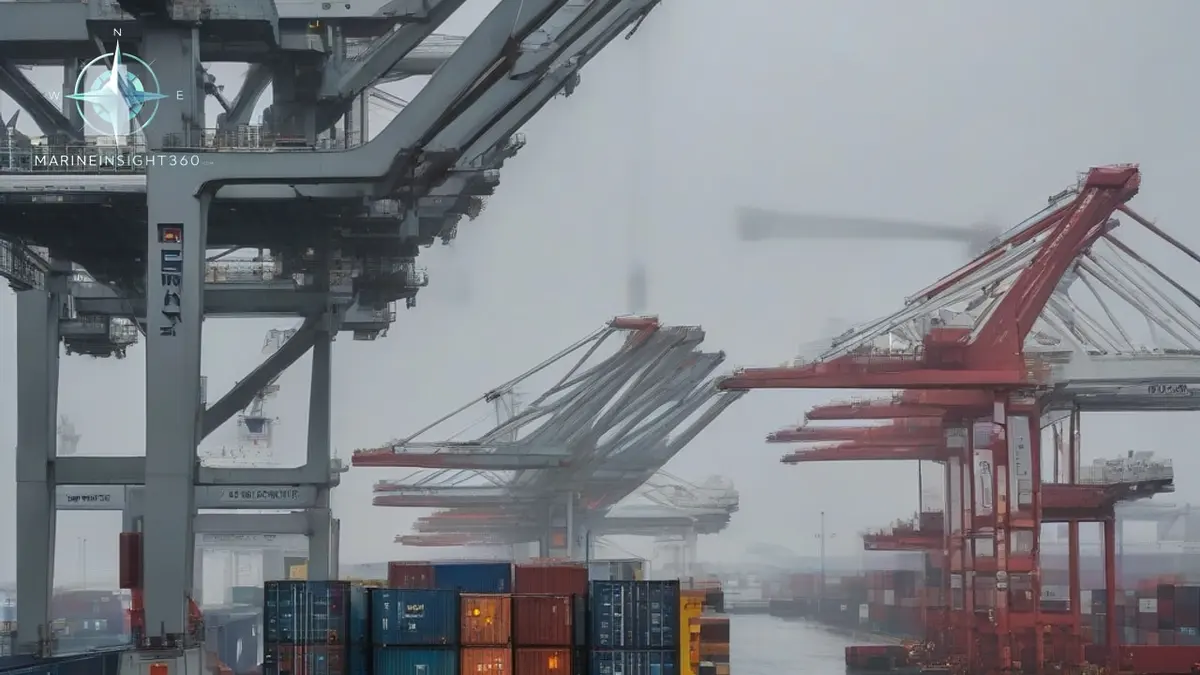
No. Port of Antwerp-Bruges did not surpass Rotterdam in container throughput for Q1 2026. Antwerp-Bruges handled 2.6 percent fewer TEU than in the same quarter of 2025 and 5.5 percent less container tonnage, while Rotterdam held container volume broadly flat at 0.3 percent growth in TEU. Rotterdam stayed ahead as Europe's largest container port.
The confusion is understandable. Both ports had a difficult quarter, both pointed to weather and geopolitics, and trade reporting carried very different TEU figures for Rotterdam depending on which estimate was used. The quarterly statements published by the two port authorities are the numbers to work from.
How Antwerp-Bruges and Rotterdam container throughput compared in Q1
Port of Antwerp-Bruges reported 65.5 million metric tons of total throughput for the quarter, down 3.2 percent year on year. Inside that total:
- Container traffic fell 5.5 percent in tons and 2.6 percent in TEU.
- Dry bulk fell 4.9 percent.
- General cargo fell 4.4 percent.
- Liquid bulk edged up 0.2 percent.
- Roll-on roll-off traffic grew.
Rotterdam reported 103.0 million metric tons for the quarter against 103.7 million a year earlier, a decline of 0.7 percent. Container throughput rose 0.3 percent in TEU but fell 3.2 percent in tons. Inland container volumes, the barge and rail legs into the European hinterland, rose 11 percent.
Why container tonnage and TEU moved in opposite directions
TEU counts boxes. Tonnage weighs what is inside them. Where TEU rises while tonnage falls, the box mix has become lighter, and the usual cause is empties. Rotterdam attributed its tonnage drop to a 14 percent rise in exports of empty containers, largely back to Asia.
That distinction matters operationally. A terminal moving more empties performs the same number of crane lifts for less revenue cargo, and the repositioning flow is a symptom of a trade imbalance rather than of demand. Benchmarking two ports on a single headline percentage produces the wrong conclusion.
What cost Antwerp-Bruges around 100,000 TEU
The port put the direct loss at roughly 100,000 TEU, equal to about 1.1 million tons. Three causes stacked up inside one quarter:
- A snowstorm and a prolonged cold spell in January.
- Severe storms in the Bay of Biscay running until mid-February, which delayed arrivals from the south.
- A four-day strike.
Weather on the approach matters as much as weather at the berth. A vessel riding out a Biscay low arrives outside its berthing window, and the terminal then works a bunched arrival pattern rather than a planned one. Throughput recovered in March once conditions settled.
Gulf disruption is now visible in European port data
Antwerp-Bruges recorded the last LNG tanker so far from Qatar arriving on 23 March, and noted container lines shifting calls to alternative ports as the quarter closed. This is the first quarter in which Middle East disruption appears directly in a Hamburg-Le Havre range balance sheet rather than only in freight rates.
For liner planners the practical effect is call omission. Where a service loses schedule integrity, the cheapest recovery is to drop the call with the longest expected wait. Both Antwerp and Rotterdam are deep-draft, multi-terminal calls that can be cut and then recovered with feeder or barge lifts.
How the two ports compare across a full year
Quarterly noise is not a trend. Across the whole of 2025, Antwerp-Bruges handled 266.5 million metric tons, down 4.1 percent on 2024, with container throughput almost stable at 0.7 percent growth in TEU and 0.4 percent in tons. Its share of the Hamburg-Le Havre range slipped to 29.3 percent over the first nine months of 2025, a fall of 1.2 percentage points, which the port linked to terminal congestion.
A single quarter of a 2.6 percent TEU decline against a flat competitor does not move a ranking built on a multi-million TEU annual gap.
Three indicators worth more than the headline TEU line
- Empty box share. Rising empty exports point to weakening European export cargo, not to port performance.
- Berth productivity and waiting time. Congestion, not demand, drove the Antwerp-Bruges market share loss.
- Hinterland modal split. Rotterdam's 11 percent inland container growth shows whether boxes are actually clearing the quay.
Both ports publish quarterly figures with segment detail, so the comparison can be repeated cleanly each quarter. For vessel and cargo planning, track the segment that carries your cargo rather than the aggregate tonnage line, and follow the Marine Insight 360 Ports section for the next quarterly update.
Antwerp carries a structural exposure Rotterdam does not. It sits roughly 80 km (50 miles) up the river Scheldt, so arrivals depend on a tidal window and on pilot availability, and fog on the river restricts traffic outright. Miss the window and the ship waits for the next tide, which is how a bad weather quarter turns into bunched arrivals and berth queues rather than a smooth recovery.
Berth time is not only cargo time. Ships calling either port are inspected under the Paris MoU, whose inspection database EMSA operates, and a detention over structural, fire safety or pollution prevention deficiencies holds a berth booked for the next arrival. Both ports also lose slots to crane breakdowns and to industrial action, none of which shows up anywhere in a throughput figure.
Sources and further reading
- External conditions impact Port of Antwerp-Bruges quarterly results
- Throughput in the port of Rotterdam remains stable, with a slight decline of 0.7%
- Port of Antwerp-Bruges ends 2025 with resilience in a turbulent trading climate
- Rotterdam throughput steady in Q1 despite Hormuz closure
What to read next
Recommended Reading
Container Tracking: How Shippers Actually Follow a Box Across the Ocean
How container tracking works, from free carrier lookups to visibility platforms: what each tool layer does, what it costs, and how to pick for your volume.
Port of Rotterdam Logistics Companies: How to Find and Choose the Right Partner
Port of Rotterdam logistics companies by category: deep-sea terminals, barge and rail operators, forwarders, tank storage and breakbulk firms.
Port Automation: How Automated Container Terminals Actually Work
Port automation explained: what automated stacking cranes, AGVs and remote quay cranes really change for terminal cost, berth productivity and crews.