
Shipping Freight Rates Explained: Container, Dry Bulk and Tanker Markets
What moves container, dry bulk and tanker freight rates, how to read the Drewry WCI, SCFI, Baltic Dry Index and Worldscale, and what drove the shipping market in 2026.
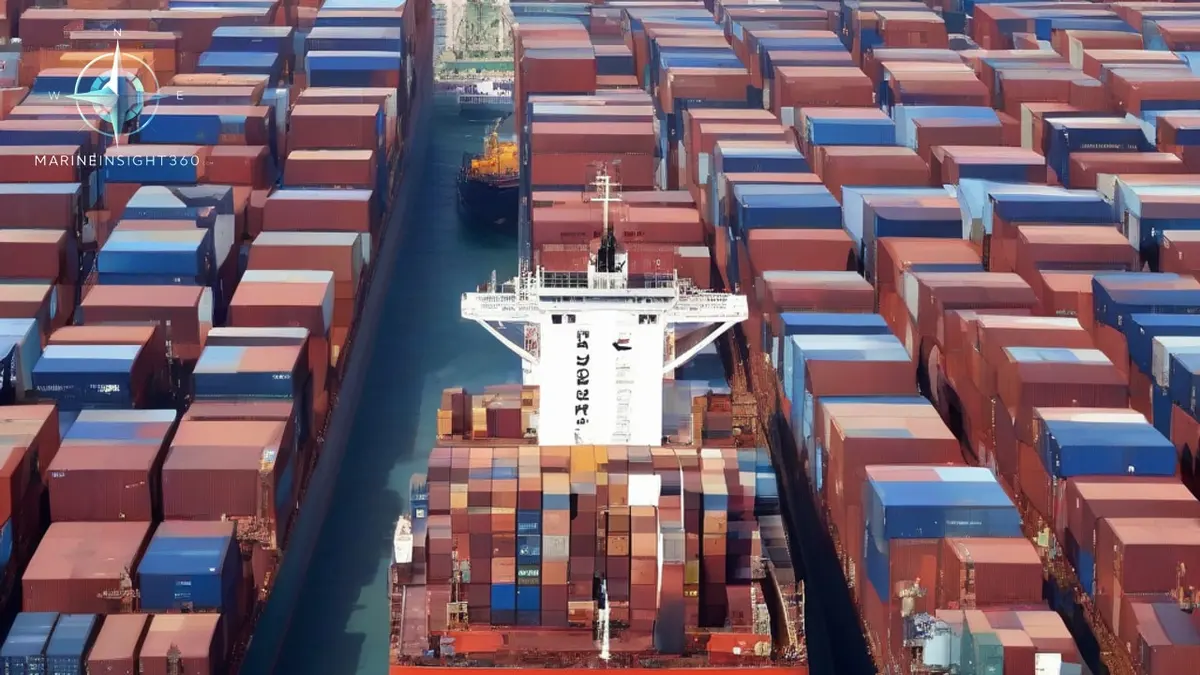
Shipping freight rates are the price of moving cargo by sea, and they swing more than almost any other price in world trade. A container from Shanghai to Rotterdam can cost three or four times as much one year as the next; a Capesize bulk carrier can earn $10,000 a day in a slump and five times that in a boom.
The reason is simple: the supply of ships changes slowly, because a new ship takes two to three years to build, while demand for cargo, and the distance it has to travel, can change in weeks. This guide explains what moves rates in the container, dry bulk and tanker markets, how to read the indices the industry quotes, and what drove the market in 2026.
The three main markets
What moves freight rates
- Fleet supply. The number of ships available, the orderbook of ships being built and the rate of scrapping. Ships ordered in a boom arrive two or three years later, often into a weaker market, which is why shipping runs in cycles.
- Cargo demand. Economic growth, industrial output, harvests, stockbuilding and trade policy. Tariff announcements cause importers to rush cargo forward before they take effect.
- Distance, measured in tonne-miles. Longer voyages use up more ship capacity. When ships avoid the Red Sea and sail round Africa, or crude moves from the Atlantic to Asia instead of from the Gulf, the effective supply of ships shrinks and rates rise even if cargo volumes do not.
- Chokepoints and disruption. Closures or attacks at the Strait of Hormuz, Bab el-Mandeb, the Suez and Panama canals, and port congestion all tie up ships. See our Strait of Hormuz and Red Sea guides.
- Seasonality. Container demand peaks in the third quarter as goods move for the year-end season; grain and coal flows follow harvests and winter heating.
- Fuel and regulation. Bunker prices, emissions costs such as the EU Emissions Trading System, and speed reductions to meet CII ratings feed into rates and surcharges. See our decarbonisation rules guide.
How to read the main indices
Container
- Drewry World Container Index (WCI): a weekly composite of spot rates, in US dollars per 40ft container, on eight East-West routes, including Shanghai to Rotterdam, Genoa, Los Angeles and New York.
- Shanghai Containerized Freight Index (SCFI): published every Friday by the Shanghai Shipping Exchange; spot rates from Shanghai to about 15 destinations.
- New ConTex: published by the Association of Hamburg and Bremen Shipbrokers since 2007; not freight rates but the daily time-charter rates owners earn for chartering container ships to lines, across six ship sizes.
Spot indices move first and furthest. Most cargo on the big trades moves on annual contracts, which follow the spot market with a lag.
Dry bulk
The Baltic Dry Index (BDI) , published daily by the Baltic Exchange in London, is a weighted average of time-charter earnings for three ship sizes. Since March 2018 it has been weighted 40% Capesize, 30% Panamax and 30% Supramax. Capesize rates move most, driven by iron ore from Australia and Brazil to China, so the BDI often follows the Capesize market. Because dry bulk cargo is raw material, the BDI is also watched as an early signal of industrial demand.
Tankers
Tanker freight is usually quoted in Worldscale points: a percentage of a nominal flat rate for each route, so WS 100 means the published flat rate and WS 50 means half of it. The Baltic Exchange's dirty and clean tanker indices track crude and product markets, and individual route assessments such as TD3C (VLCC, Middle East to China) are the figures traders quote.
Daily earnings are often given as time-charter equivalent (TCE), which converts a voyage rate into dollars a day after fuel and port costs.
Spot, contract and charter rates
A shipper can buy space at the spot rate for a single shipment or sign a contract rate for a year. A shipowner can fix a ship on a voyage charter , paid per tonne of cargo with the owner paying fuel and port costs, or on a time charter , paid per day with the charterer paying for fuel and deciding where the ship goes. Each shifts risk between the parties differently; see time charter versus voyage charter costs and the main risks in charterparties.
The 2026 market in brief
- Containers: Peak season started early. By early July the Drewry WCI had risen 9% in a week to $4,530 per 40ft container, its highest since the 2022 peak, as importers pulled cargo forward ahead of tariffs and the Hormuz closure disrupted Gulf services. By late August, port congestion was holding more than 4.3 million TEU of capacity, and Asia to US spot rates were near their mid-2022 peak. (Splash247; Linerlytica)
- Container charter: The New ConTex rose to 1,629 points in late August, and owners continued to order feeder and mid-size ships for delivery in 2028. (Hellenic Shipping News; Splash247)
- Dry bulk: The BDI rallied from about 2,700 in late July to above 3,000 in August, reaching 3,186 at the end of the month, led by Capesize. The start of iron ore exports from Simandou in Guinea added a long-haul trade to China, though much of it is moving on dedicated very large ore carriers. Dry bulk transits of Hormuz roughly halved after the US blockade of Iranian ports was reimposed. (Hellenic Shipping News; Splash247)
- Tankers: Newbuilding orders rose 358% year on year by mid-June, to 444 ships including options, led by VLCCs and Suezmaxes. Crude tonne-mile demand for VLCCs weakened while smaller crude tankers gained share, even as large-tanker rates rose. (Hellenic Shipping News; Gibson, via Splash247)
Frequently asked questions
Why are container freight rates so volatile?
Because the fleet cannot change quickly. When demand jumps or ships are tied up by detours and congestion, there are no spare ships to add, so prices rise sharply until demand falls or new ships arrive.
What does the Baltic Dry Index tell you?
The daily earnings of dry bulk ships, weighted 40% Capesize, 30% Panamax and 30% Supramax. It reflects demand for raw materials, especially iron ore and coal, and the supply of bulk carriers.
What is a TEU and an FEU?
A TEU is a twenty-foot equivalent unit, the standard measure of container capacity. An FEU is a forty-foot container, equal to two TEU. Spot indices such as the Drewry WCI are quoted per FEU.
What is Worldscale?
The tanker industry's pricing scale. Each route has a published flat rate in dollars per tonne, and freight is agreed as a percentage of it: WS 80 means 80% of the flat rate.
Related guides
- Time charter vs voyage charter costs
- The main risks in charterparties
- Container ships and TEU sizes
- Deadweight tonnage explained
- Strait of Hormuz shipping
Sources
- Drewry, "World Container Index: methodology"
- FreightWaves, "Baltic Dry Index re-weighted", February 2018
- Association of Hamburg and Bremen Shipbrokers, "New ConTex"
- Splash247, "Container spot rates hit four-year highs", July 2026
- Splash247, "Thenamaris makes boxship move", August 2026
- Hellenic Shipping News, "Baltic Dry Index breaks 5-day advance", August 2026
- Splash247, "Pan Ocean linked to four VLCC order at Hanwha Ocean", June 2026
- Splash247, "China's VLOC conveyor belt threatens to dilute Simandou cape upside", August 2026
Recommended Reading

What is a Bulk Liquid Terminal?
A bulk liquid terminal is an area within a seaport equipped with the necessary infrastructure for storing and transporting large quantities of liquefied liquids or gases.
Container Loading and Unloading: How Boxes Move Between Ship, Yard and Warehouse
How container loading and unloading actually works: stowage plans and cut-off dates, ship-to-shore cranes, yard handling, and stuffing at the warehouse.

Container Tracking: How Shippers Actually Follow a Box Across the Ocean
How container tracking works, from free carrier lookups to visibility platforms: what each tool layer does, what it costs, and how to pick for your volume.